Boomi Cloud API Management Developer Blog
RSS FeedNew Feature: Chart and Legend Interactivity
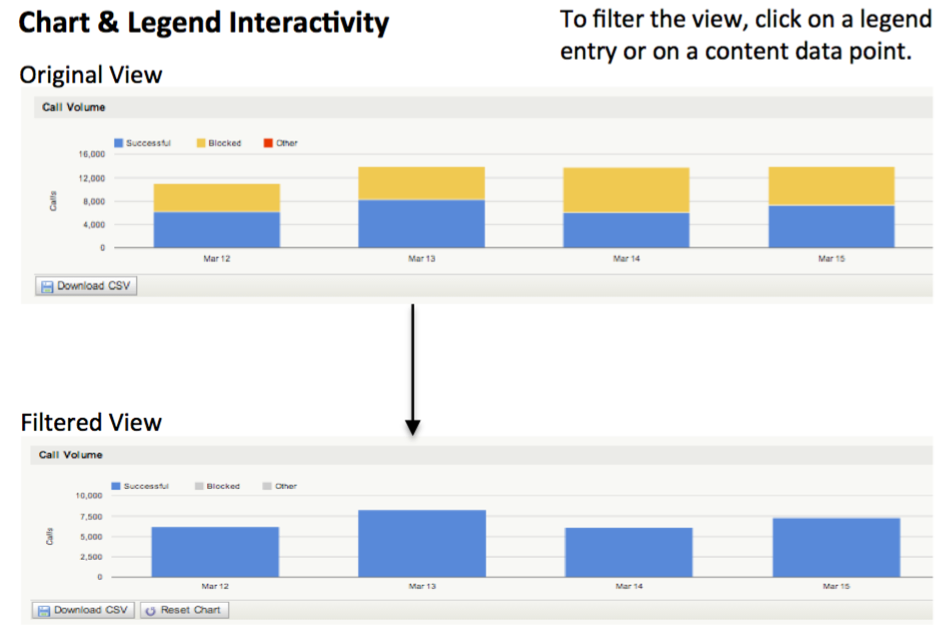
New Feature: Chart and Legend InteractivityMashery is pleased to announce the release of a new report drill down feature that will revolutionize the way our customers extract insights from our reporting and analytics offering.
This new enhancement is available for all customers and is applicable throughout the reports portfolio.
Our customers can now drill-down to specific content by either 1) clicking on the legend entry for the interesting content 2) clicking on a data point associated with the interesting content.
If at any time our customer can click the newly visible “Reset Chart” button to return to the original chart state.
See diagram below for additional details.
This reporting and analytics enhancement serves as the latest way that Mashery is committed to delivering a steady stream of innovations to our customers.
New Feature: Cache reports
Mashery is pleased to announce the release of a new set of reports that enables our customers to enjoy new levels of visibility into the API performance benefits provided by our caching feature.
These newest reports are available for all customers and can be found with the Reports tab of the Administration dashboard as follows:
For a selected Package or Service > System Status > Cache
Each of the new reports can also be filtered to a particuilar Package and Plan.
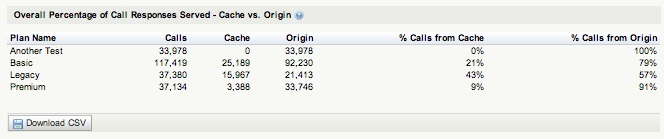
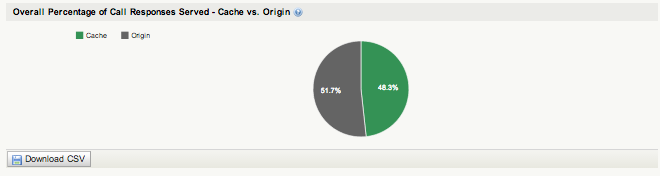
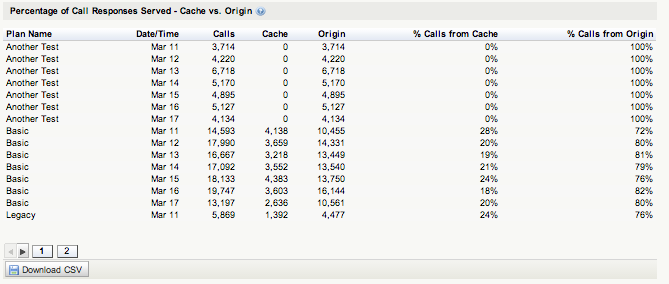
The report entitled “Overall Percentage of Call Responses Served” is designed to provide customers with the tools to quantify the aggregate volume of API calls served from each source: the Mashery Cache vs. the customer’s backend infrastructure a.k.a. the Origin.
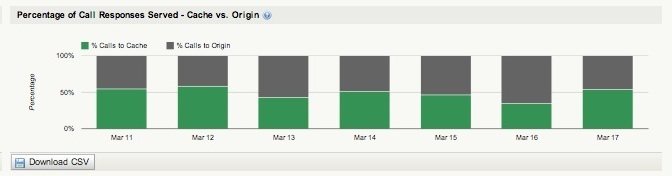
The report entitled “Percentage of Call Responses Served” is designed to provide customers with visibility into the trending for the volume of API calls served from each source.
I look forward to seeing the new and exciting ways that our customers further adopt the caching feature to improve their downstream user experience.
Mashery Local 2.2 Released !
Mashery Local 2.2, with new and improved tools for Mashery Local Operations and Support staff is now available ! With this release, tools are available to assist with debugging any issues with API calls as they flow between client application, Mashery Local and your API back-end system . In addition, tools that help gather diagnostics and address Mashery Local configuration issues are also available
The tool to introspect API call data is enabled via a simple control on the Mashery Local Cluster Manager UI interface. For the duration this is enabled, Mashery Local will produce verbose call data logs that can be written out to a local location or a shared NFS location. The tool has an auto shut-off capability when the timer expires.
Each API call produces a directory that is stamped with the Mashery Message ID – a globally unique identifier for each call that flows through Mashery. If you are not familiar with using Mashery Message ID in your request /response headers to create a golden thread between your partners, Mashery and your back-end systems, see this post. Using this GUID, your support staff can quickly drill down to the call logs for the problem API call.
For each API call’s verbose data logs, you can review details such as the call request as it hits Mashery, as its processed by Mashery before being submitted to API back-end system, response as its delivered by back-end system and response as its processed by Mashery. This level of visibility into call data helps address questions such as whether the issue is due to the processors applied or the API back-end system.
Apart from this verbose call data logging facility, this release also includes a debug utility made available via a command line console. The debug utility provides several options to the user, some come in handy when you need to gather Mashery Local system health information to diagnose common system configuration errors on Mashery Local. Other options are useful to resolve some issues identified as an outcome of the diagnosis.
For customers with a Mashery Local license, please contact us at support@mashery.com to obtain the image and release notes.
New Feature: Program-wide API Call Reports
Mashery is pleased to announce the availability of a new report that provides customers program-wide visibility of API call volumes across their entire product offering.
This new report, entitled API Call Volume by Service and Type, can be found in the Reports section of the Mashery Administration dashboard within the summary page, and is automatically turned on for all customers. Customers using the API Packager feature would see a similar report entitled API Call Volume by Package and Type.
This release represents the latest way that Mashery is providing guidance to our customers to identify interesting program components that would be great candidates for additional review time of the associated business and technical metrics.
Below is a screen-shot of the new report for a selected API Service:
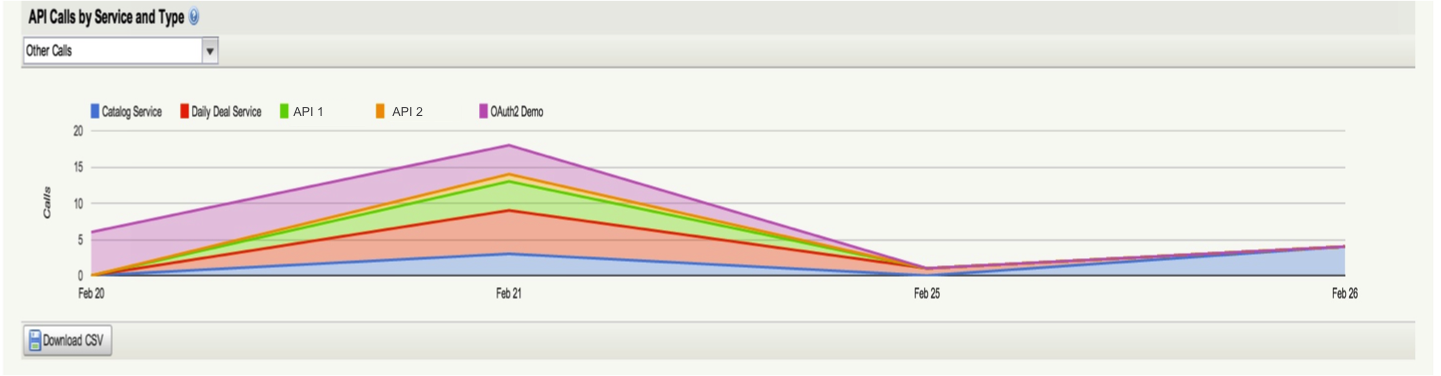
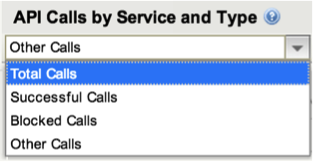
This report also makes use of the common additional drilldown into each API Call type:
New Feature: Spotlights Reports
Mashery is pleased to announce the release of Spotlights, a new set of reports that enables our customers to enjoy unprecedented levels of visibility into the performance of their API programs.
The new Spotlights set of reports have been designed to answer a diverse collection of interesting business questions through new data visualizations depicting the behavior of individual developers and the overall API program alike. Customers can find the Spotlights section under the Reports Tab in the API Usage navigation area.
I look forward to seeing the new and exciting ways that our customers gain a competitive advantage by utilizing these data visualizations of their API program data.
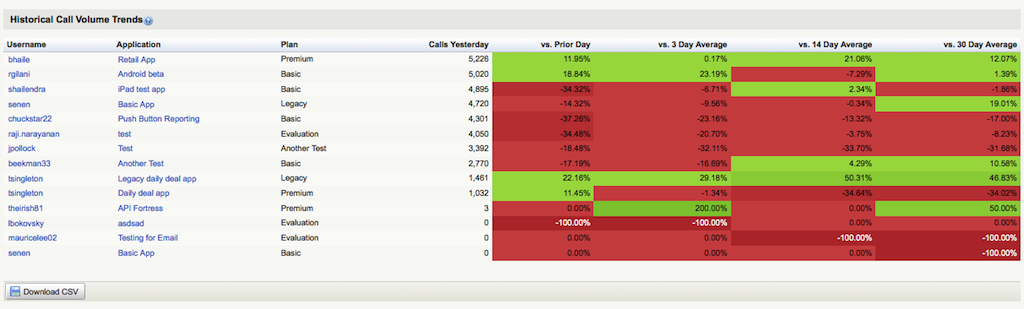
The Spotlights report entitled “Historical Call Volume Trends” is designed to provide customers with the tools to identify developers who have:
- an increasing trend of consuming the API data and would be excellent candidates for potential showcasing broadly in future communications
- a decreasing trend to consuming the API data and would represent opportunities for an API program account manager to proactively engage
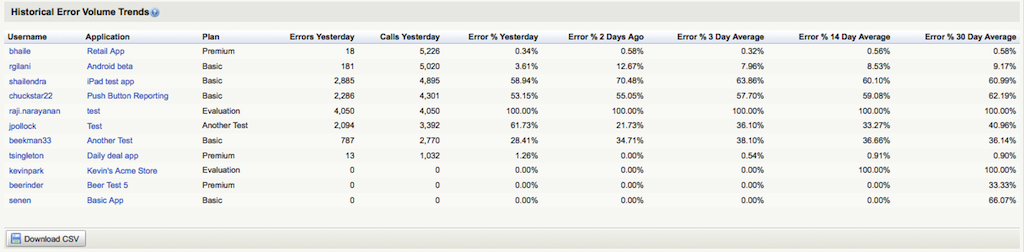
The Spotlights report entitled “Error Volume Trends” is designed to provide customers with the tools to identify developers who have:
- a trend of unsuccessfully consuming the API data and would benefit from additional guidance or documentation on best practices
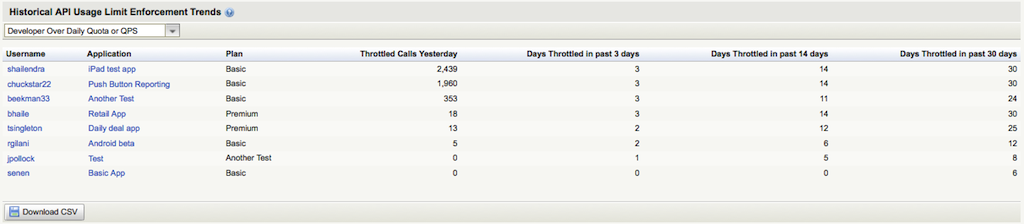
The Spotlights report entitled “Historical API Usage Limit Enforcement Trends” is designed to provide customers with the tools to identify developers who have:
- a trend of exceeding the current API data consumption limits applied by the API provider with regard to the daily quota of requests allowed (Quota) or to the allowed calls-per-second (QPS).
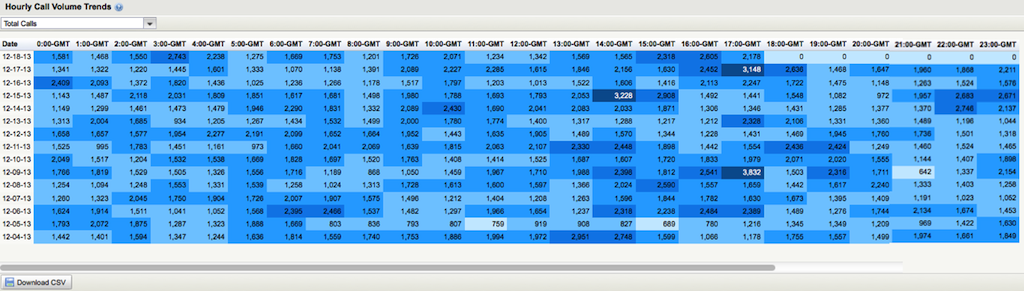
The Spotlights report entitled “Hourly Call Volume Trends” is designed to provide customers with the tools to identify:
- trends in the overall hourly demand pattern of the API program with respect to the distribution of successful or unsuccessful consumption of API data
I/O Docs: Changes to Access Token Request
Based on feedback and to be in line with the OAuth 2.0 specification, Mashery has made a small but important change to the way I/O Docs makes requests for OAuth access tokens.
Who's affected: Depending on your OAuth 2 access token provider's implementation, you may need to modify it to receive the token request credentials in the Authorization header. This is the compliant way to receive credentials and will successfully work with I/O Docs. For customers using Mashery OAuth Accelerator, no change is required.
Issue: I/O Docs was incorrectly passing credentials in the POST body (URL encoded) and the Header. This is not in compliance of the spec and will result in a 400 (invalid_request) in the response from the authorization server.
Whats changed: I/O Docs will send the client ID/secret pair in the Authorization header. This change is necessary to comply with OAuth2 spec RFC, ttp://tools.ietf.org/html/rfc6749#section-5.2
Necessary Action: Modify your authorization code to receive the token request credentials in the Authorization header. This is the compliant way to receive credentials and will successfully work with I/O Docs
If you're impacted by this change, we appreciate your time to make the minor modification on your end. We'll continue to make improvements to I/O Docs based on your feedback.
Mashery Local 2.1 is now available !
Today we rolled out yet another update to the Mashery Local product. Mashery Local 2.1 includes a roll-up of several Traffic Manager features such as improved CORS support, end-point wild-card parameters and OAuth accelerator improvements while continuing to ensure that the product functions well in the context of Mashery's unique hybrid architecture. For details on these features , please see the respective blog entries.
API Data volume trends now available in Mashery
Mashery is pleased to announce the availability of a new set of reports that enables customers to quantify the volume of data being served through their API program. This represents the latest way that Mashery is supporting the efforts of our customers to widely broadcast the achievements of their API programs to other internal stakeholders and to the broader public audience alike.
I look forward to seeing the exciting new ways that customers seek to define their API achievements using data-oriented definitions. Remember that comparing data quantities hinges on how you define it! For example, the 5 gigabytes (5 x 10^9 bytes) of storage capacity contained within the original iPod was touted as holding “1000 songs in your pocket.”[1] A “Library of Congress” worth of data based on current estimates amounts to 15 terabytes of data (15 x 10^12 bytes).[2]
This new report, entitled Data Served, can be found within the Reports section of the Mashery Administration dashboard and is automatically turned on for all customers.
Below is a screen-shot of the new Data Served report for a selected Package & Plan

Below is a screen-shot of the new Data Served report for a selected API Service

References:
[1] http://support.apple.com/kb/HT1353
[2] http://blogs.loc.gov/digitalpreservation/2012/04/a-library-of-congress-worth-of-data-its-all-in-how-you-define-it/
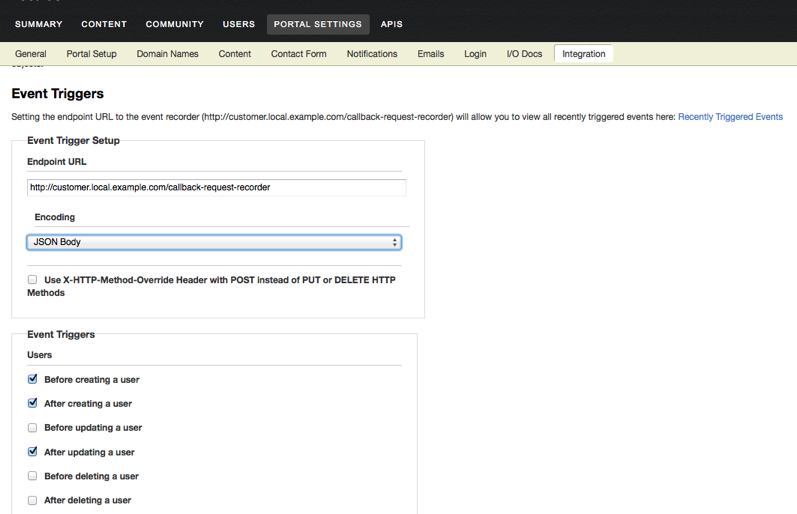
New Feature: Event Trigger API
We are pleased to announce the release of the Event Trigger API, a new way to integrate your API related business processes and systems with the Mashery platform. The Event Trigger API makes it easy to connect these business systems, e.g. a 3rd party CRM product, internal data warehouse or custom billing solution, with the Mashery processes and data that drive your API program. Whether performing custom validation rules to ensure that developers who are signing up to the portal are desired or appropriate to supplementing developer or application data in the Mashery database with information stored in your own system to simply recording the issuance of new keys for applications in a separate, non-Mashery database, the Event Trigger API is a real-time integration tool, allowing you to both streamline processing by forgoing potentially more complex integration paths as well as to generate a better user experience that works in line with your business.
The Event Trigger API is configured through the Mashery Dashboard and authorized individuals pick and chose the business objects of interest and when to receive data and notifications. There is a simple testing tool that enables you to understand the flow of the data and get you more familiar with the feature. The API is documented here. A screenshot of part of the configuration UI is show below.
Please contact support@mashery.com for more information and to have this feature turned on for you.
Improved CORS support in Mashery
With the release last night, Mashery has added yet another useful feature based on your feedback!
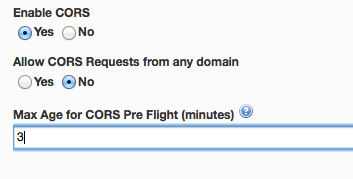
CORS (Cross Origin Resource Sharing) is a W3C standard that defines how browsers and servers can interact with one another and provides a mechanism for web applications to make requests to a resource in another domain. All major browsers support this standard. Mashery has made it easy to leverage this standard with just a few button clicks and without requiring changes to your back-end API server. In addition, by using this optional feature available in Mashery, you can offload pre-flight request / response management to Mashery. That is, if a valid pre-flight request comes through, Mashery will prepare an appropriate pre-flight response with the right headers as well as perform the necessary validations on whether the requested method is allowed on the API end-point.
Below is a screen-shot of these new settings that are available while configuring your API end-points